
Smart property monitoring platform with compliance tracking
A case study on designing a centralized property monitoring platform with intuitive dashboards, real-time notifications, and streamlined compliance management for real estate professionals.
Industry Real Estate · PropTech
Services Product Strategy · UX/UI Design · Dashboard Design · Design System
A web platform that helps property owners monitor violations, permits, and compliance from a single dashboard.

Overview
Managing multiple properties often requires checking several government portals, tracking permit expirations, and monitoring compliance manually. We designed a centralized platform that brings all critical property information into one place, helping property owners identify issues faster and stay ahead of deadlines.
Challenge
The product needed to transform fragmented public data into a simple, actionable experience. Users had to monitor multiple properties, review violations, track permits, and receive timely updates without navigating several external systems. The biggest design challenge was organizing complex operational data into dashboards that remained clear, scalable, and easy to scan.
Solution
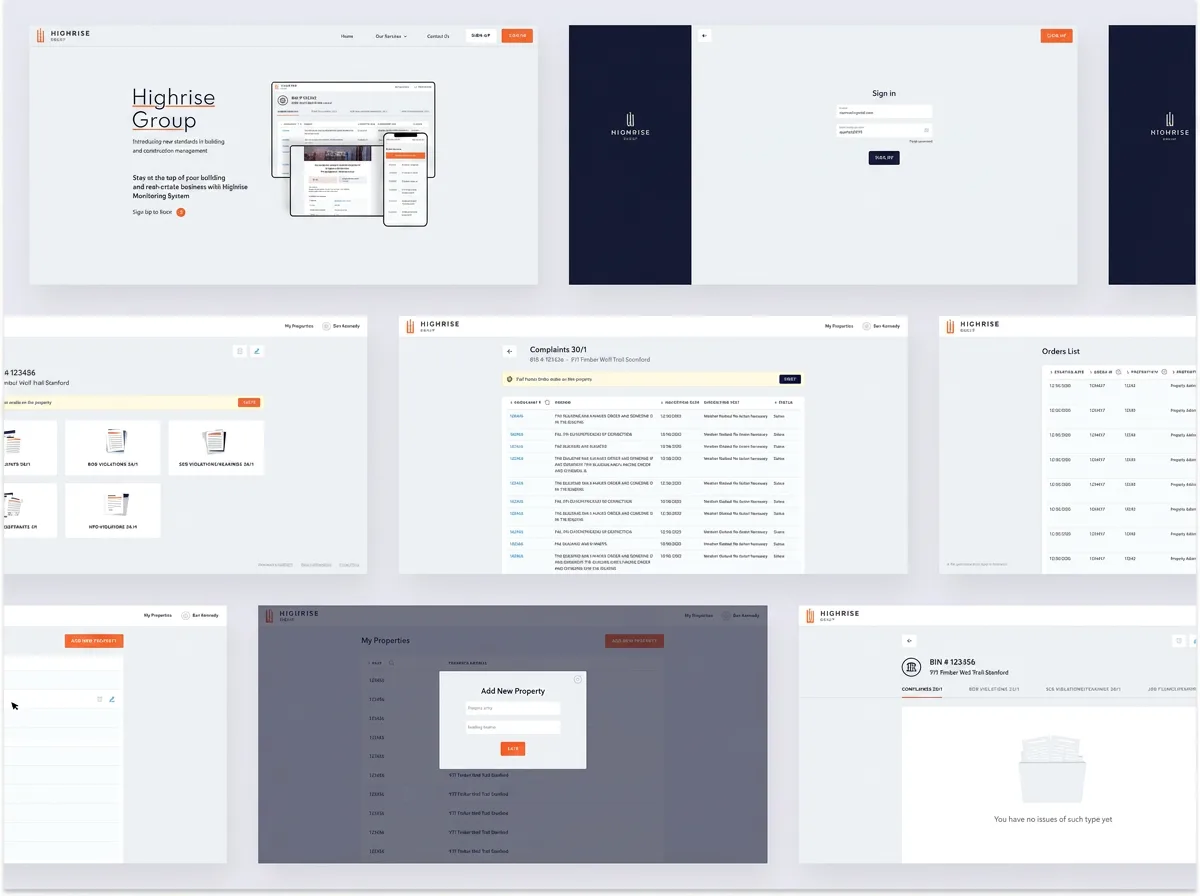
We designed a modern dashboard that gives users a complete overview of their property portfolio, recent violations, permit status, hearings, and notifications. Clear information hierarchy, filtering, search, and reusable UI components help users find important information quickly while supporting future product expansion.
Key Features
Centralized property portfolio management
Violation and permit tracking
Real-time notifications and reminders
Search, filtering, and property analytics
Responsive dashboard for desktop and mobile
Scalable design system for future features
Design Approach
The interface was built around clarity and efficiency. Dense operational data is organized using visual hierarchy, cards, tables, and color-coded statuses that make critical information immediately recognizable. A clean, minimal visual language reduces cognitive load while allowing users to monitor dozens of properties with confidence.